
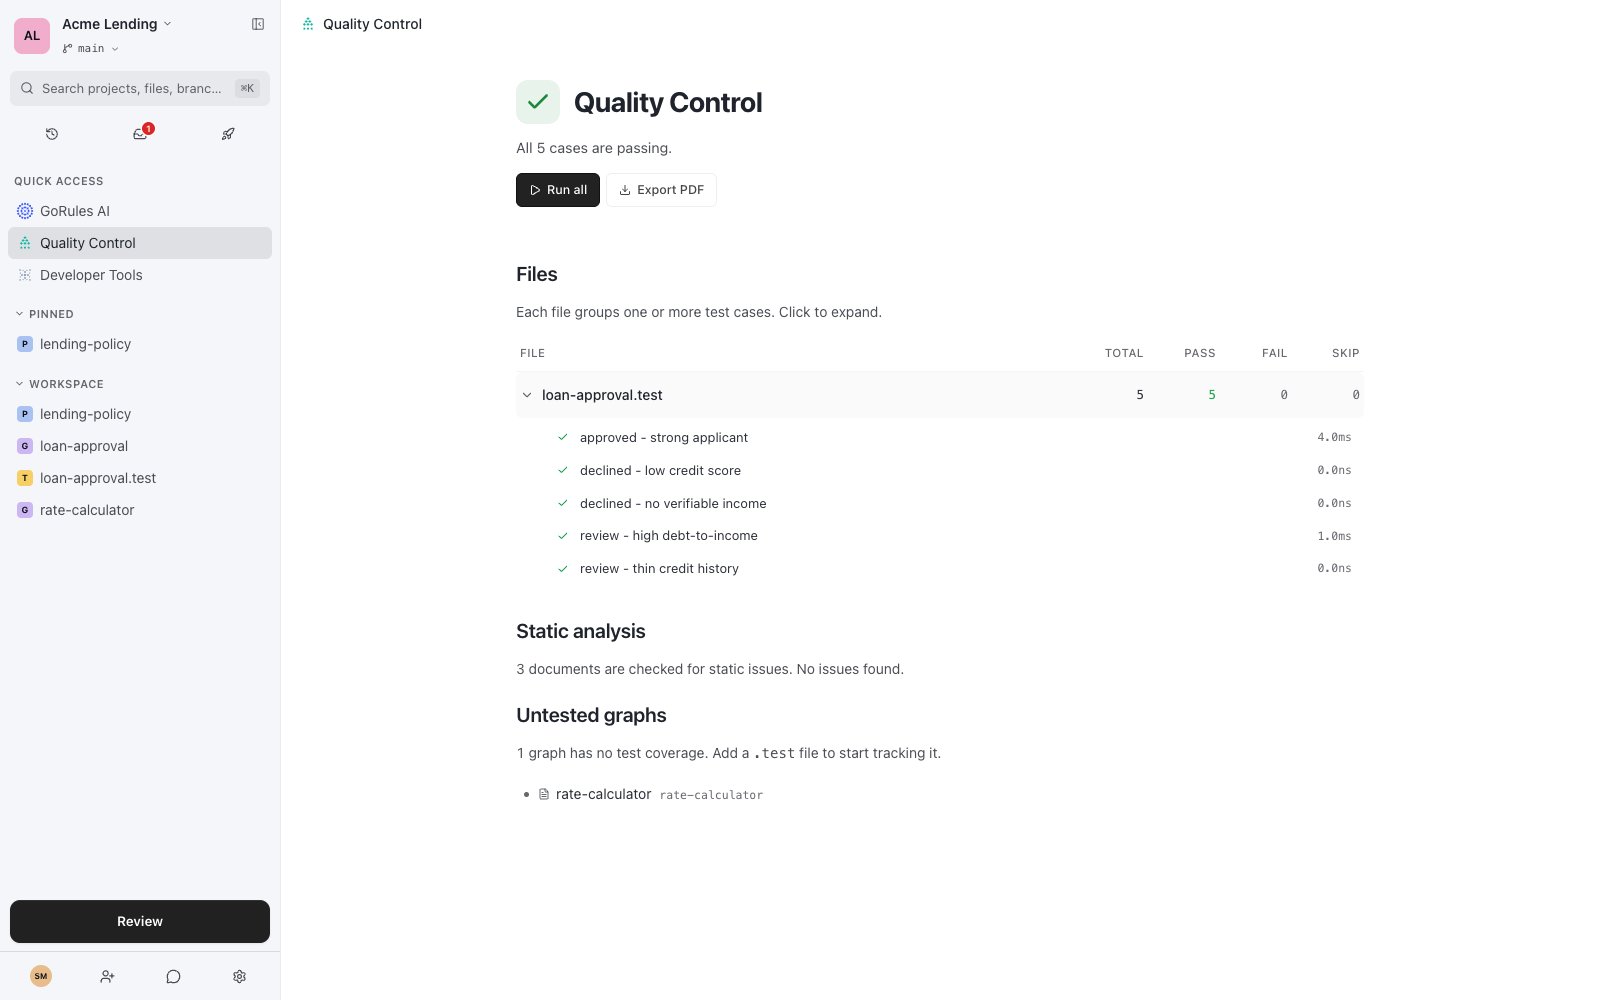
The Quality Control page
Running the suite
Click Run all to execute every test case in every test file on the current branch. The Files table shows one row per test file with its totals - pass, fail, skip - and expands to individual cases with their status and timing. Click Export PDF to produce a shareable report of the run - useful for sign-off, audits, or attaching to a release.Static analysis
Every graph and policy on the branch is checked continuously for static issues - type errors, conflicting rules, dead logic. The page summarises how many documents are clean and how many have findings; expand a file to see each diagnostic and click it to jump straight to the offending node or block. See the static analysis reference for every check and what it means.Untested graphs
Graphs with no test coverage are listed by name. Add a.test file alongside a graph and it moves into the Files table automatically. Coverage here is deliberately simple: a graph either has tests exercising it or it doesn’t.