
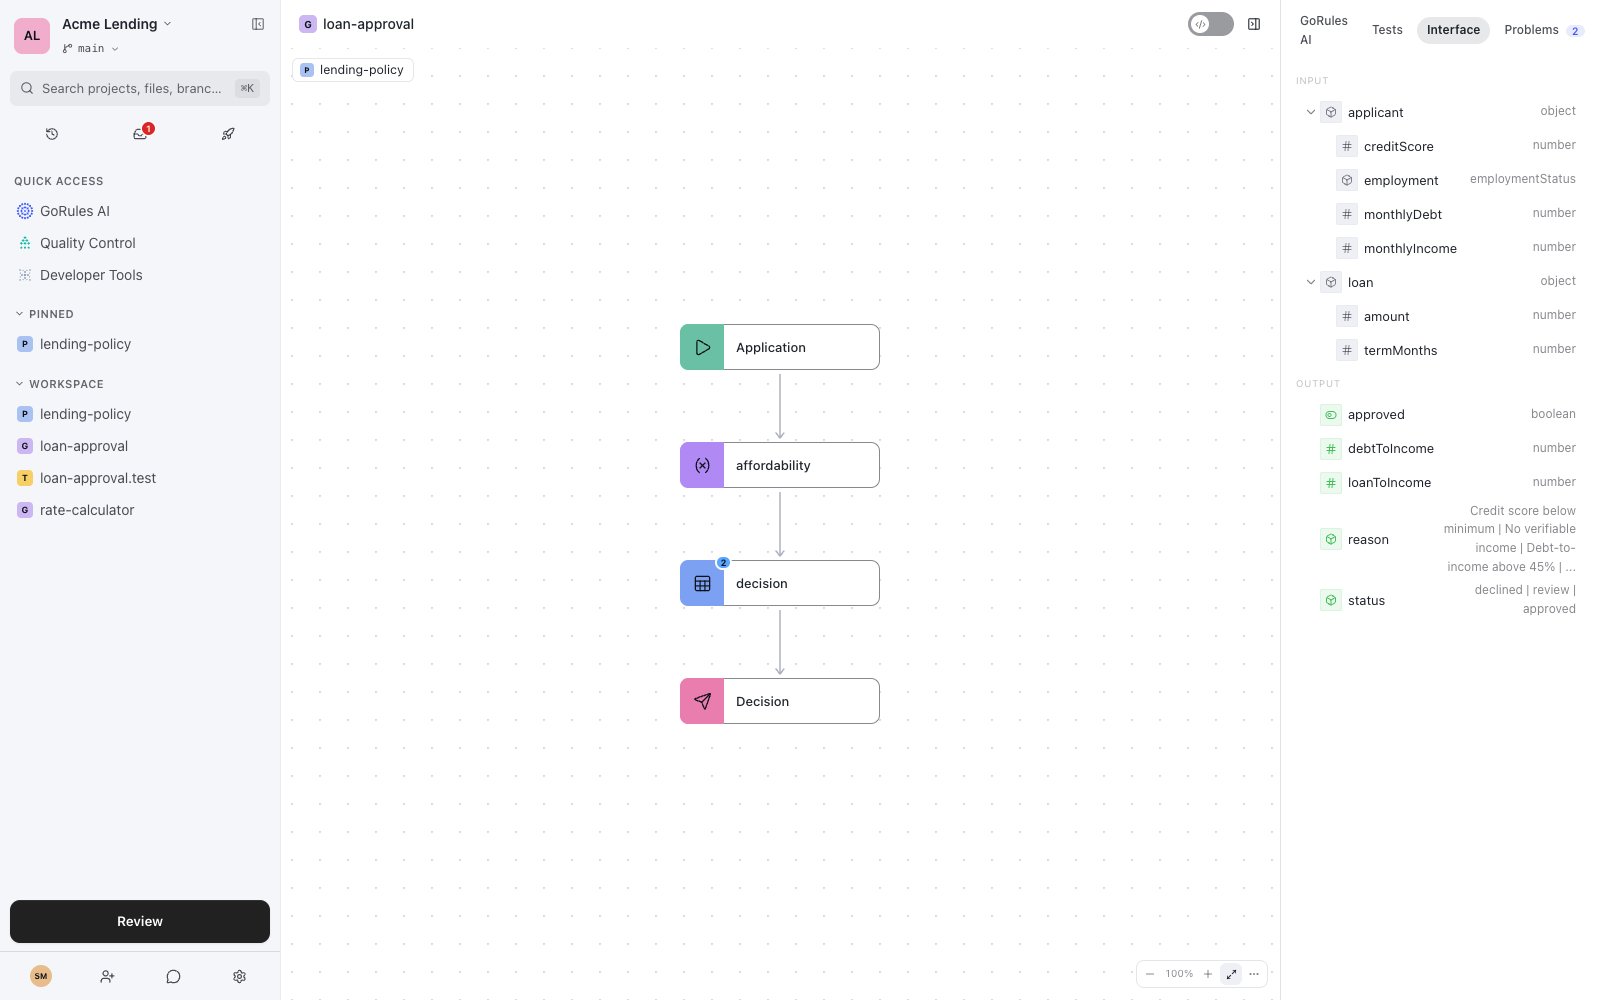
A decision graph with an imported policy and the Interface panel open
The canvas
Add nodes from the canvas, connect them with edges, and drag to rearrange. Each node has quick actions for duplicating, copying, and deleting, and a settings dialog for its configuration - hit policy for decision tables, execution mode, input field, output path, and pass-through behaviour. Zoom controls sit in the bottom-right corner. Fit view centres the whole graph.Importing policies
Click Import above the canvas to import a policy. Imported policies appear as chips; each chip opens the policy or removes the import. Importing a policy brings its dictionaries into the graph. Dictionary values become available as decision table column types and in schema definitions, so business users pick from labelled options instead of typing raw values. In the input schema, reference a dictionary as a field type with{"$dictionary": "employmentStatus"}. At evaluation time the engine expands it into the dictionary’s value set and rejects inputs outside it - the vocabulary you defined once in a policy also guards what callers can send.
The side panel
Interface
The Interface tab shows the graph’s contract: every input property with its type, and every output the graph computes. The input schema is editable here - and it matters. A graph without a real input schema cannot be statically checked, so define your inputs early.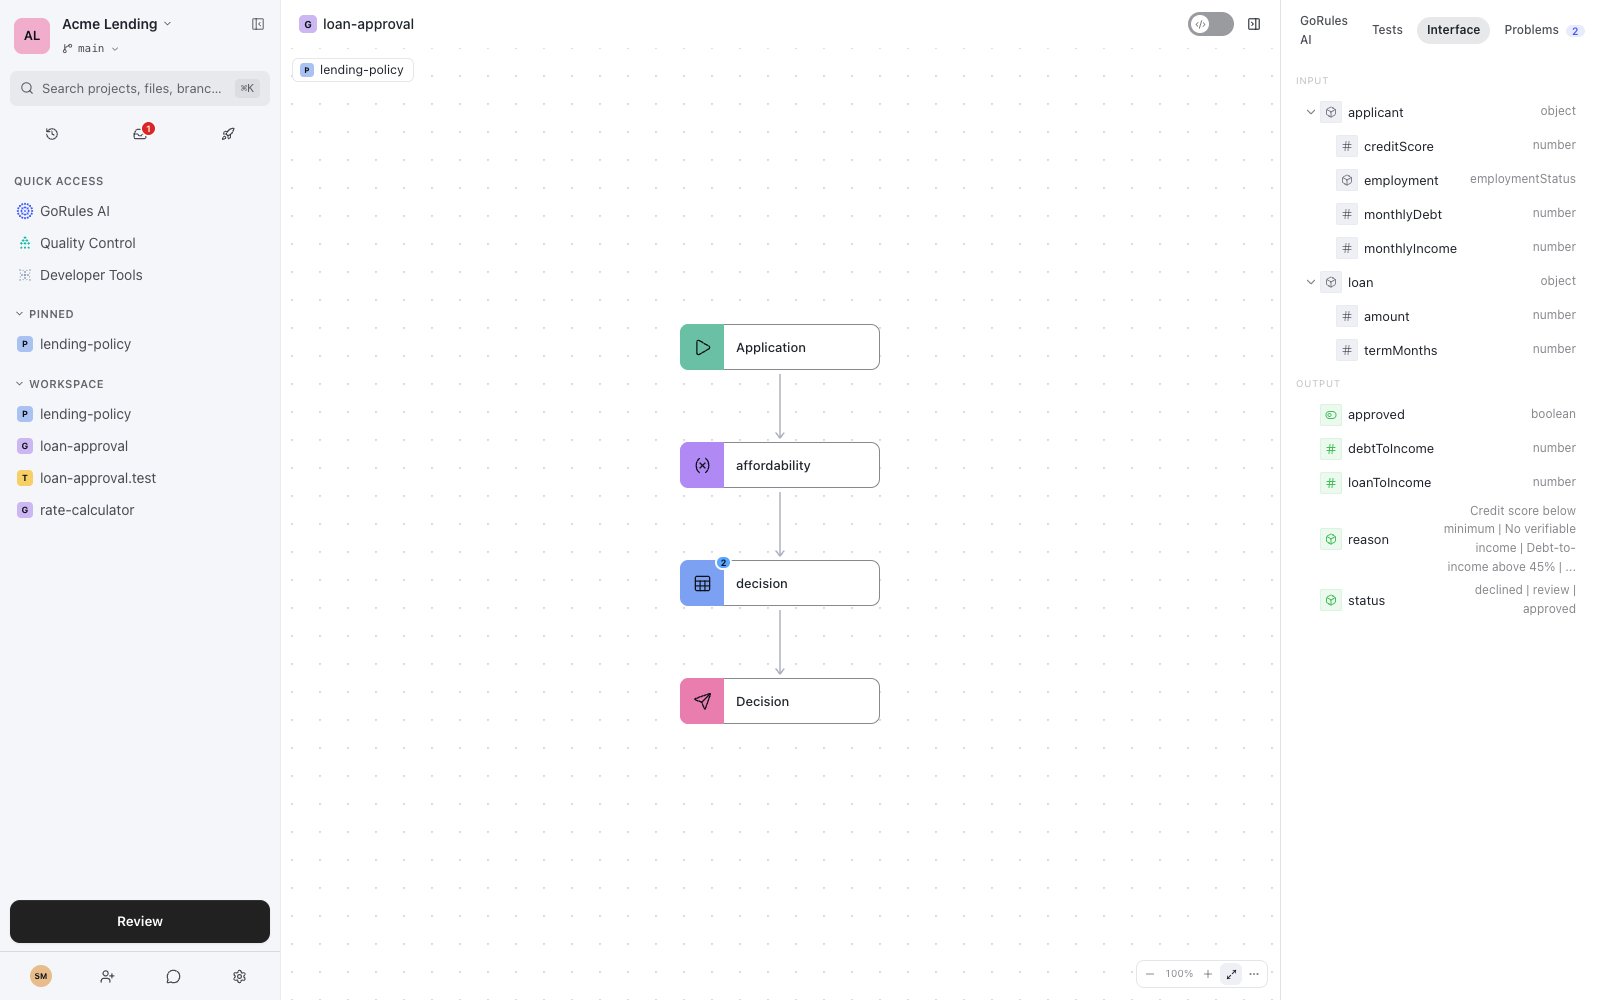
Resolved input and output types
Problems
The Problems tab lists everything static analysis found in this graph - type mismatches, unreachable nodes, redundant logic - each with an explanation and a suggested fix. Click a problem to jump to the node it came from.Tests
The Tests tab runs the graph’s test cases without leaving the editor.GoRules AI
The GoRules AI tab opens the assistant scoped to this graph. Ask it to explain the flow, add nodes, or write tests.Simulating
Open the simulate panel to run the graph with a JSON input. You get the output, per-node trace data, and an Explain action on values so you can see how a result was derived. A good simulation run can be promoted to a saved test event, so a one-off debugging session becomes a permanent regression check.Decision tables
Decision tables evaluate rows top to bottom - conditions on the left, outputs on the right. Two capabilities worth knowing:- Output columns can be typed, including with dictionary types from imported policies. Typed columns validate their cells and offer labelled dropdowns in business mode.
- Tables support Excel and CSV import and export, with a column-mapping step when the file doesn’t match the table exactly.
Related pages
Policies
Shared definitions your graphs can import.
Static analysis
What the Problems tab checks for.